Fixture Congestion Fatigue: Tracking Rotation Patterns in Multi-Competition Weeks for In-Play Value
Amir Richter · May 18, 2026
Fixture Congestion Fatigue: Tracking Rotation Patterns in Multi-Competition Weeks for In-Play Value
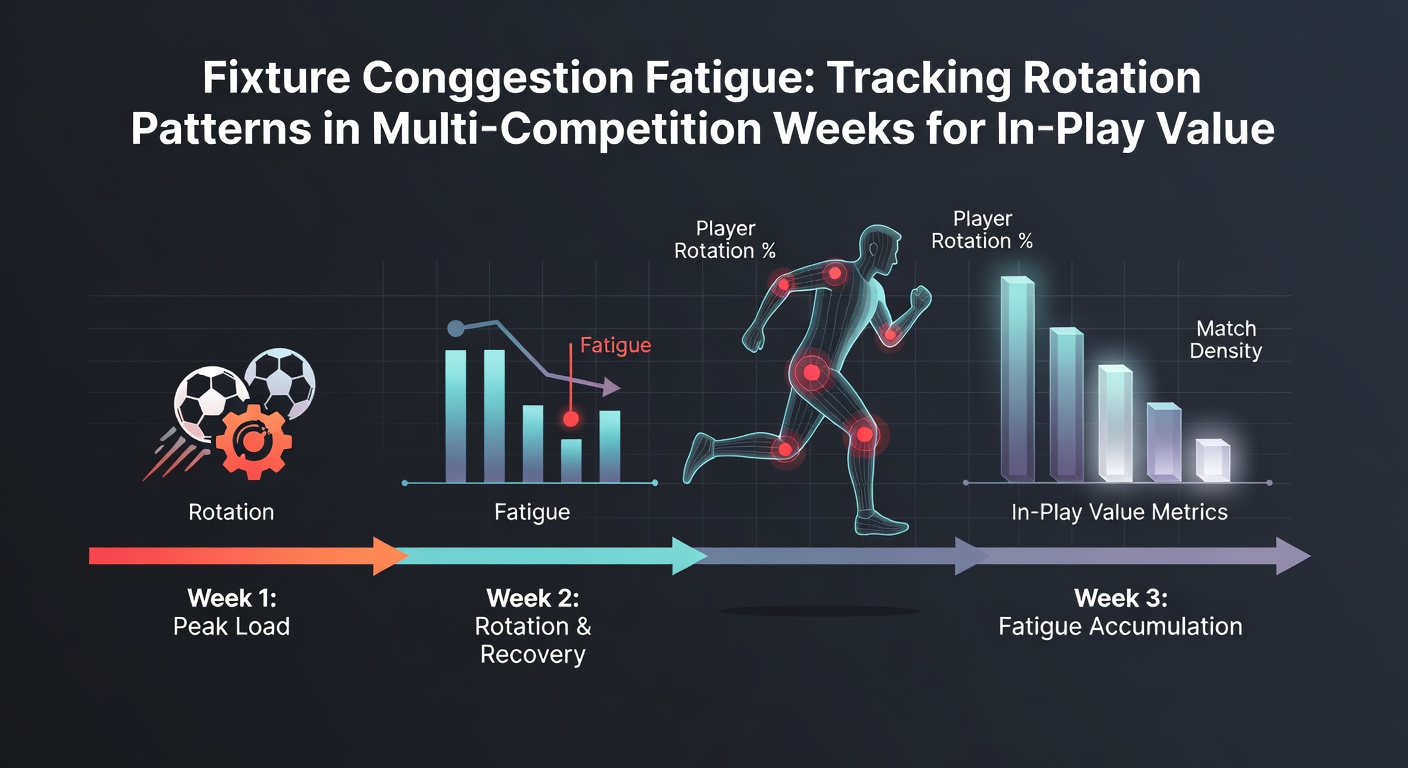
Football schedules pack multiple competitions into tight windows each season, and teams respond with deliberate rotation to manage player workload. Data from European leagues shows that clubs contesting domestic cups alongside league and continental ties often alter starting lineups by 30 to 40 percent compared with standard matchweeks. Observers note that these adjustments create measurable shifts in team performance metrics, particularly in the second half of fixtures where fatigue patterns emerge most clearly.
Understanding Congestion Windows and Their Timing
Multi-competition periods cluster around specific calendar blocks, with the busiest stretches occurring between late February and early April before a final push in May 2026. During these weeks clubs face three matches in eight or nine days, forcing coaches to balance recovery needs against tactical requirements. Researchers tracking squad usage across the Premier League, La Liga and Serie A have documented consistent drops in high-intensity running distance when teams play three fixtures inside a single week, with the effect compounding after the second match.
Rotation decisions follow observable patterns rather than random selection. Managers typically rest central midfielders and full-backs first because those positions accumulate the highest physical loads, while preserving attacking players who contribute directly to goal outputs. One study of Bundesliga rotations revealed that teams resting at least two starters from the previous match improved their expected goals by 0.4 per 90 minutes in the subsequent fixture.
Data Patterns in Player Workload and Substitution Timing
Performance databases compiled over five seasons indicate that players logging more than 270 minutes across a nine-day window show a 12 percent decline in successful pass completion rates after the 70th minute. This drop appears most pronounced in away fixtures where travel adds an extra recovery demand. Analysts following these trends have started flagging in-play markets that price second-half goal totals higher once congestion indicators exceed established thresholds.
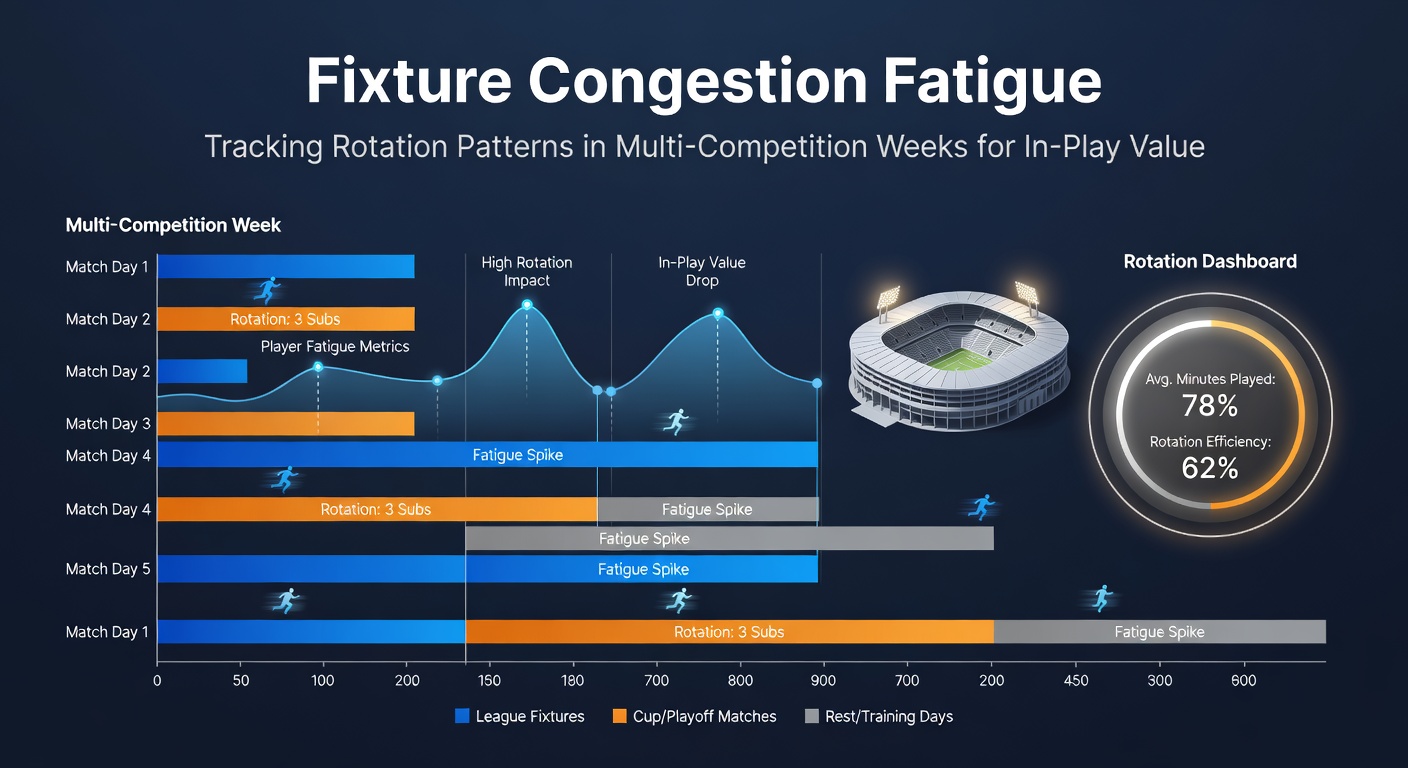
Substitution timing provides another layer of information. Teams that make their first change before the 60th minute during congested periods maintain possession percentages closer to their season average, whereas delayed substitutions correlate with a measurable increase in shots conceded. Live bettors monitoring these patterns gain an edge when they identify managers who follow predictable rotation cycles rather than reacting only to scorelines.
League-Specific Rotation Tendencies
English clubs tend to rotate more aggressively in Carabao Cup and FA Cup ties when European commitments loom, while Spanish and Italian sides preserve core starters for continental matches and rest players in domestic fixtures. Figures released by the European Club Association show that La Liga teams averaged 4.2 lineup changes per match during March 2025 congestion windows, compared with 2.8 changes in non-congested periods. These differences translate into distinct in-play value opportunities depending on the competition and venue.
Case examples from the 2024-25 season illustrate the point. One mid-table side that rotated six players ahead of a Europa League quarter-final maintained a higher pressing intensity for longer stretches, resulting in an elevated rate of counter-attack goals after the 75th minute. Bettors who tracked the squad announcement and cross-referenced historical workload data positioned themselves ahead of live markets that adjusted slowly to the rotation signal.
In-Play Market Implications and Timing Windows
Live betting platforms update odds continuously, yet rotation effects often surface first in possession and territorial metrics rather than the scoreboard. When teams display early signs of reduced sprint recovery in congested weeks, the probability of late goals rises measurably. Tracking tools that combine player tracking data with substitution logs allow observers to anticipate these shifts before the market fully incorporates them.
According to a report published by the German Football League’s sports science unit, clubs that implement structured rotation policies reduce soft-tissue injury rates by 18 percent during peak fixture periods. This reduction in absences further stabilizes expected lineups, giving bettors a clearer baseline for projecting second-half dynamics. Markets focused on player props and corner counts have shown particular sensitivity to these workload adjustments.
Tools and Indicators for Monitoring Rotations
Publicly available squad lists, combined with historical usage charts from Opta and similar providers, form the foundation for rotation tracking. Advanced models incorporate minutes played in the preceding 14 days, travel distance and fixture difficulty ratings to generate fatigue scores. Those who apply these scores to live markets have recorded improved accuracy in predicting when teams will concede territorial control after the 65th minute.
Weather and pitch conditions add secondary variables. Heavy rainfall during congested blocks increases physical demands and accelerates fatigue, a factor noted in several Scandinavian league studies. Observers who integrate meteorological data with rotation patterns refine their timing for entering or exiting in-play positions.
Conclusion
Fixture congestion creates predictable rotation cycles that influence performance metrics and open specific windows for in-play value. Teams that follow established workload management practices produce measurable changes in possession retention, pressing intensity and late-game outputs. By monitoring squad announcements, historical usage data and substitution timing, market participants can identify these shifts as they develop rather than after the scoreboard reflects them. Continued refinement of tracking models and access to granular performance figures should sustain these analytical approaches through the 2026 calendar cycle and beyond.