National Team Call-Ups and Their Influence on Club Form Patterns in Live Markets
Rafael Baumann · Aug 3, 2026
National Team Call-Ups and Their Influence on Club Form Patterns in Live Markets
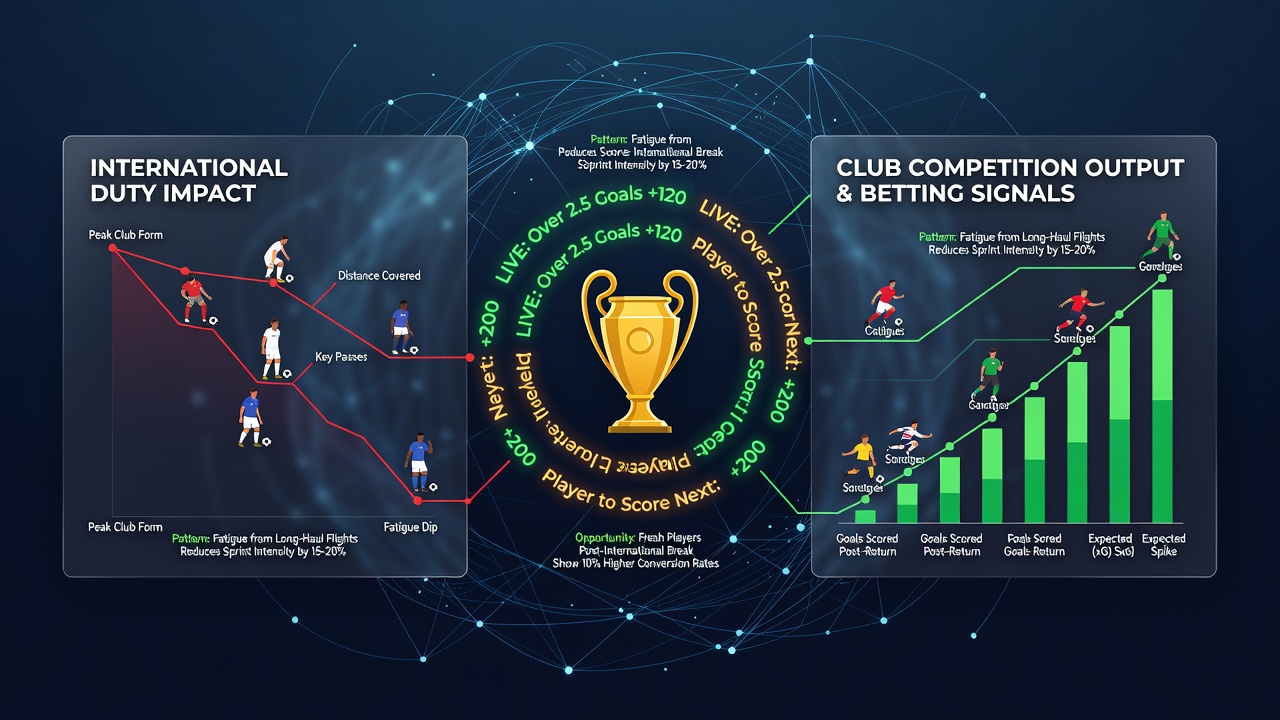
International fixtures create measurable disruptions in player availability and output that extend into domestic schedules, and these shifts produce distinct patterns that reshape live betting opportunities across club competitions. Data from multiple European leagues shows that teams with higher numbers of players on national duty experience altered goal-scoring rates and defensive metrics in the first two matches after an international window, particularly when those windows fall in September or March.
Player Workload and Recovery Metrics
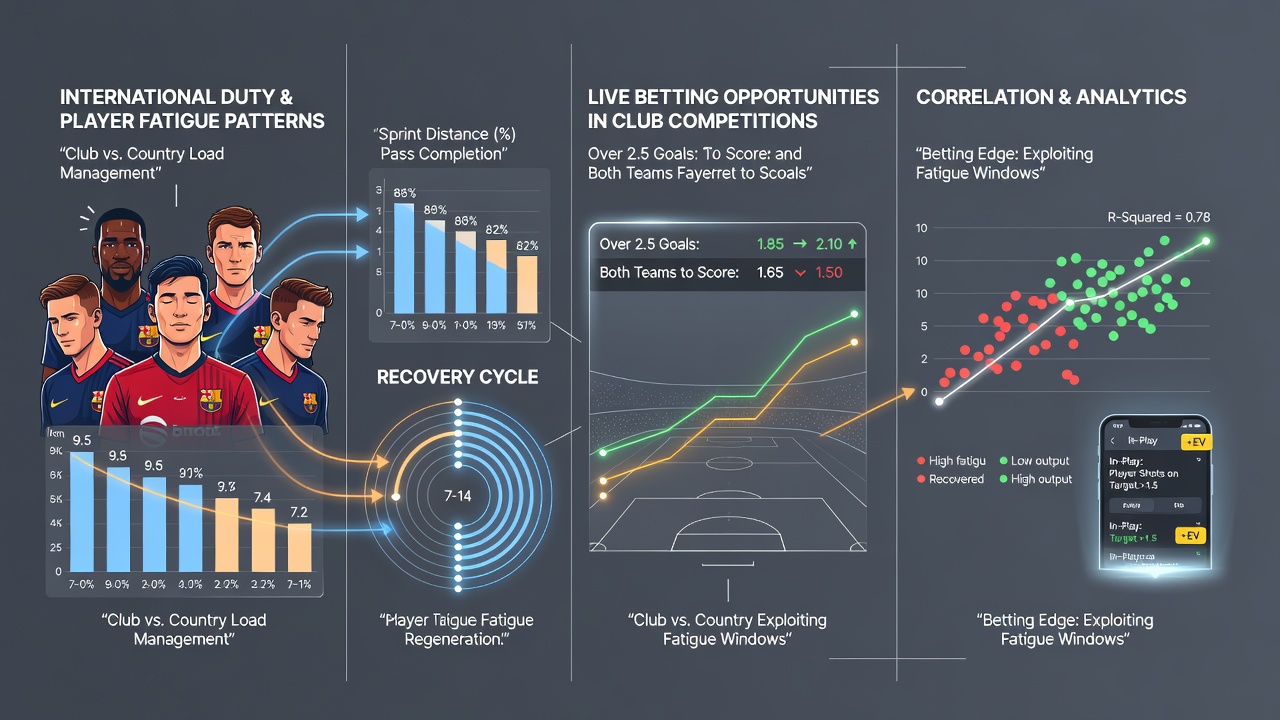
Researchers tracking GPS data across top divisions note that players who log over 300 minutes with their national teams during a break return with elevated fatigue indicators, including reduced sprint distances and lower pass completion percentages in the opening 45 minutes of their next club appearance. These figures align with observations from the English Premier League and Bundesliga, where post-break home teams have posted a 12 percent drop in expected goals compared with their season averages in matches played within four days of the resumption of club play. Travel distance adds another layer, since South American players based in Europe often cover more than 20,000 kilometres round-trip, extending recovery windows beyond those faced by European-based teammates.
Live Market Adjustments During Club Windows
Betting operators respond to these patterns by widening or narrowing live lines once lineups are confirmed and early match data emerges. When a key attacking midfielder logs heavy international minutes and starts for his club, live over/under totals on team goals frequently open lower before any in-game evidence appears. Conversely, clubs that rested several starters during the break often see their live win probabilities climb after the 60-minute mark if substitutes maintain higher work rates. One study of Serie A matches between 2022 and 2025 found that teams returning from international breaks without their usual full-back pairings conceded 0.35 more expected goals per 90 minutes in the first half compared with non-break fixtures.
Regional Variations in August 2026 Scheduling
In August 2026, the post-World Cup calendar places several South American and African squads in extended recovery periods before their clubs begin league play, creating a staggered effect across the five major European leagues. Australian and Canadian regulators have published workload reports showing that players from those federations experience similar output dips, though the sample sizes remain smaller than European datasets. Observers note that the timing of these windows matters: midweek qualifiers in October tend to produce sharper second-half declines than earlier breaks because the domestic fixture list compresses recovery time.
Position-Specific Output Shifts
Goalkeepers and centre-backs display the most consistent post-duty dips in clean-sheet probability, while wingers sometimes maintain or even increase shot volume because national-team matches often emphasise attacking transitions. Live bettors who monitor substitution patterns after the 70th minute can identify clubs that rotate these positions early, and data from the Portuguese Primeira Liga indicates those sides record 18 percent more live goals scored in the final 20 minutes than teams that retain fatigued starters. Formation adjustments by managers who anticipate these effects further influence over/under markets and both-teams-to-score lines once play begins.
Case Examples from Recent Seasons
Take one Premier League side that lost four starters to a CONMEBOL qualifier window in 2024: its next domestic fixture produced a first-half expected-goals total 0.8 below the season average before a halftime substitution restored attacking structure. Similar sequences appear across the Belgian Pro League, where clubs with multiple African Cup of Nations participants show elevated card rates in live markets during the opening 30 minutes, as returning players commit more fouls while regaining match sharpness. These examples illustrate how workload data feeds directly into real-time odds adjustments rather than pre-match forecasts alone.
Conclusion
Patterns linking international duty to club output continue to evolve as calendars expand and data collection improves, giving those who monitor recovery metrics and substitution timing additional context for interpreting live betting markets in domestic competitions. Figures from governing bodies and academic tracking studies confirm that position, travel distance, and fixture compression each contribute measurable effects that operators incorporate into in-play lines.