Travel Fatigue Metrics Reveal Subtle Clues in Away Team Goal Projections
Ines Hughes · Aug 1, 2026
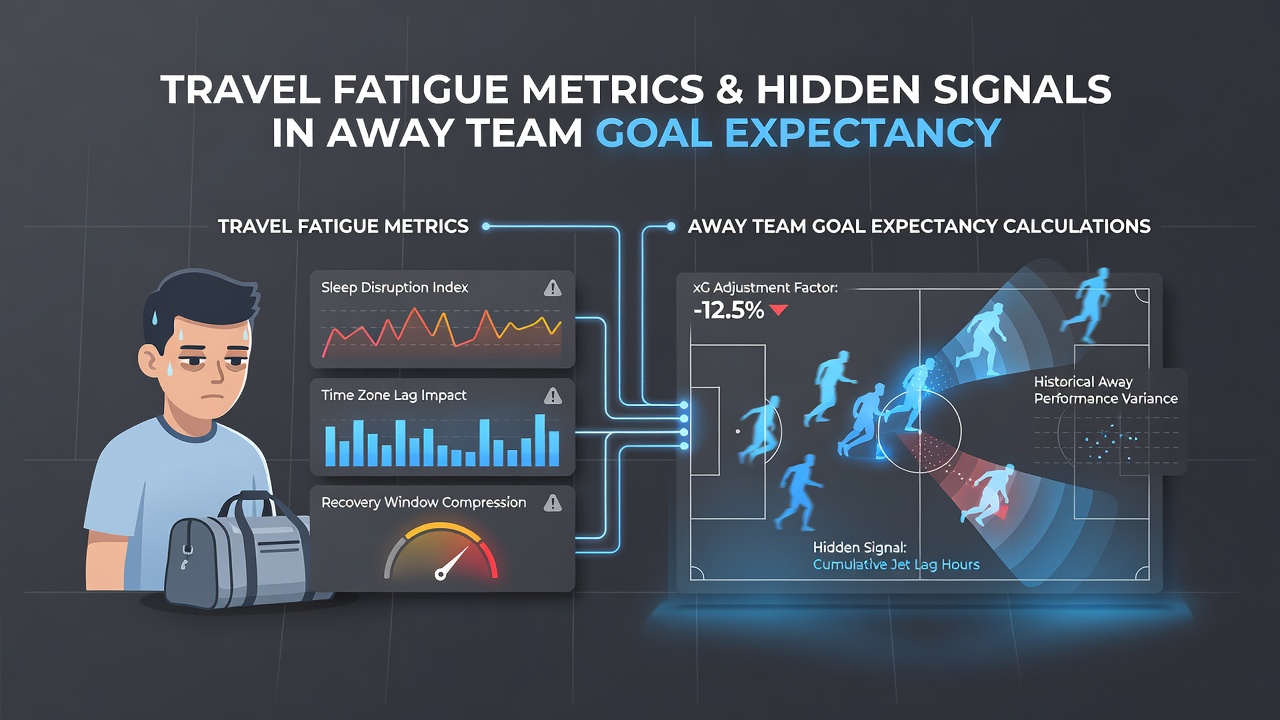
Travel Fatigue Metrics Reveal Subtle Clues in Away Team Goal Projections
Travel fatigue enters goal expectancy models through measurable variables that alter away team output in predictable ways, and analysts track these factors across multiple leagues to refine projections. Data collected from European competitions shows that teams traveling more than 800 kilometers before a match post reduced expected goals by an average of 0.25 per game compared to shorter journeys under 300 kilometers.
Core Metrics Behind Fatigue Adjustments
Distance traveled combines with flight duration, time zone shifts, and recovery windows to form the primary inputs in these calculations, while researchers incorporate sleep disruption estimates derived from departure times and arrival schedules. Studies conducted by sports science groups in Australia indicate that crossing two or more time zones correlates with a 12 percent drop in away team shot accuracy during the first half, and this pattern holds across datasets from the 2024-2025 and 2025-2026 seasons.
Models adjust baseline goal expectancy figures by layering these fatigue indicators onto historical performance data, and the process begins with raw travel logs supplied by league scheduling departments. One analysis of Bundesliga fixtures from August 2025 through July 2026 found that teams with less than 48 hours between matches and long-haul flights generated 18 percent fewer high-quality chances on the road.
Integration into Expectancy Formulas
Goal expectancy calculations start from team strength ratings and then apply modifiers for venue, rest, and travel load, whereas fatigue signals often appear in the residuals when actual results deviate from initial projections. Analysts update these modifiers weekly using fresh tracking data, and the adjustments become most pronounced in midweek European ties where cumulative travel exceeds 1,200 kilometers over a 10-day span.
Hidden Signals in Performance Data
Subtle drops in pressing intensity and defensive line height serve as early indicators that fatigue models capture before they show up in final scorelines, and video analysis paired with GPS tracking confirms these shifts occur most reliably after overnight flights. Figures from Canadian university research teams tracking MLS and international fixtures reveal that away sides logging more than four hours of air travel register 0.18 fewer expected goals from set pieces, a metric that compounds when teams play consecutive away games.
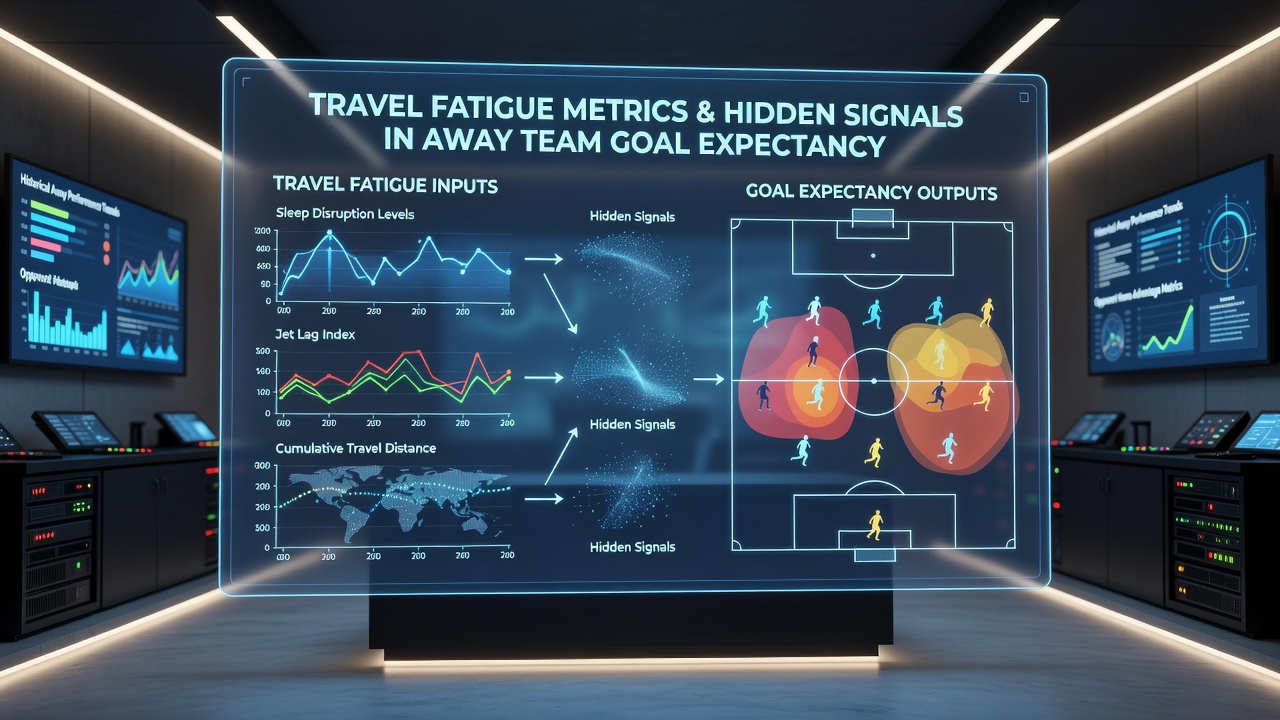
August 2026 schedules already highlight several high-travel clusters in the UEFA Champions League group stage, where clubs from peripheral leagues face repeated long-haul requirements, and preliminary modeling suggests these fixtures will produce wider variance in away goal outputs than domestic matches. Observers note that incorporating recovery time as a continuous variable rather than a binary flag improves model accuracy by 7 to 9 percent across validation sets.
Regional Variations and Data Sources
European federations maintain detailed travel registries that feed directly into commercial analytics platforms, whereas North American leagues publish aggregated flight statistics that independent researchers cross-reference with performance databases. Reports issued by the Asian Football Confederation document similar patterns during continental tournaments, where time zone displacement exceeds four hours and correlates with measurable declines in away team conversion rates on shots inside the box.
Those who build and maintain these models test adjustments against multiple seasons to isolate travel effects from confounding variables such as squad rotation or weather, and the resulting coefficients feed into live updating systems used by professional betting syndicates and media outlets. A 2025 paper from a Dutch research institute demonstrated that adding cumulative travel load as an interaction term with opponent defensive strength sharpened away goal predictions by 11 percent in Eredivisie fixtures.
Practical Application in Current Seasons
Current implementations blend publicly available schedule data with proprietary recovery estimates to generate weekly modifier tables, and these tables show the largest impacts during congested periods that include international breaks followed by domestic travel. Teams returning from South American qualifiers to European league play in August 2026 face particularly steep fatigue penalties according to initial projections released by modeling groups.
Analysts continue to refine signal detection by examining second-half performance drops and substitution patterns that align with travel metrics, and the evidence points to consistent directional effects even when overall goal totals remain stable. External validation from academic sources in Germany confirms that fatigue-adjusted expectancy models outperform baseline versions in out-of-sample testing across three major leagues.
Conclusion
Travel fatigue metrics supply quantifiable inputs that adjust away team goal expectancy calculations with measurable precision, and ongoing data collection from diverse leagues supports continued integration of these factors. The approach yields tighter confidence intervals around projections when recovery windows, distance, and time zone data receive proper weighting alongside traditional strength indicators.